


Report templates are built from PowerShell script and Microsoft Excel files, this article will dive deeper into the Microsoft Excel files.
Webroot makes the Excel file completely accessible to users. The first sheet contains the actual report and layout that will be presented as the report results. The remaining sheets contain the data, pivot tables and other elements used to create the charts, graphs and data displayed on the first sheet.
Note: It is assumed that you have advanced experience with Excel before attempting to modify the template file. The internet has a variety of options that can assist with learning advanced Excel concepts.
By modifying the Excel template, you can:
- Customize the visual aspects of the report, including adding a logo, modifying colors, changing the layout.
- Add new graphs and charts that meet your specific needs
Note: If you do want to take a closer look at a report template, it is best done with an Excel file that actually contains data. After running a report, you can access the output folder to open the Excel template by clicking the blue folder in the Report Status tab in the Universal Reporter tool.
Diving into a template file
Excel template files are located in:
- C:\Users\[user]\Documents\Webroot Reporting\Runs\[directory with time stamped name]\Output
Where:
- [user] refers to the user account that installed Universal Reporter.
- [directory with time stamped name] refers to the directories found in C:\Users\[user]\Documents\Webroot Reporting\Runs that have a time stamp type name. An example of a directory name is 20190913T2209034728607Z. The directory name is created at the time the report is run.
This example will take a closer look at the Endpoint: Summary report template, which is using a test console for data.
Here is first sheet of the template file:
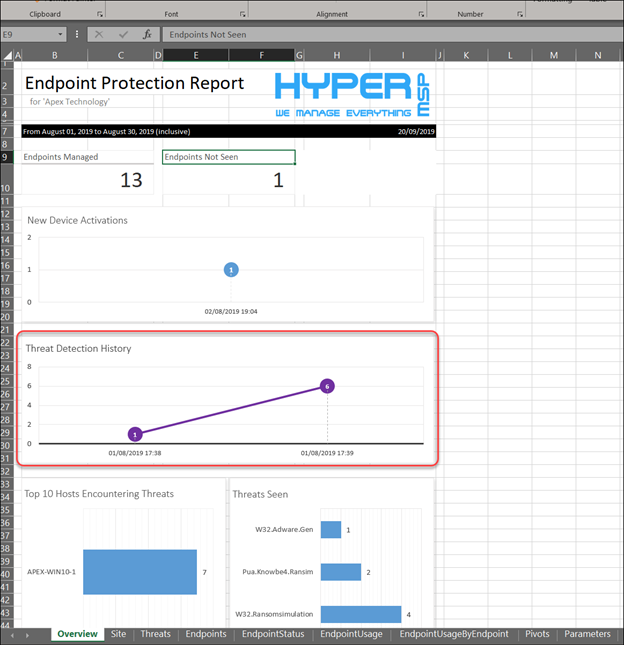
Click the Threat Detection History graph. You will see this is a pivot table, which is used often in templates.
To view the data source for this pivot table:
- Click the table to select it.
- In the Excel top level menus, click the Analyze tab then the Change Data Source button.
- A window will appear, displaying more information about the data source used for this pivot table.
- Click Cancel to exit and not make changes.
This process can be repeated to explore and understand how each of the pivot tables works for each template file.
For additional information on Universal Reporter, please see: