

I found this weird file in my C:Users{name}AppDataLocal
Here is the file properties
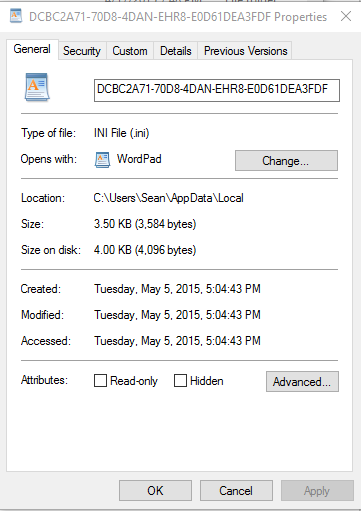
SecureAnywhere Scan Log (Version v9.0.8.72)
Log saved at Wed 2016-03-02 19:40:16
v9.0.8.72
Windows 10.0 (Build 10586) 64bit (Hostname: SEAN - Local IP: 192.168.1.127)
Scan Started: Wed 2016-03-02 19:39:15
Files Scanned: 1
Malicious Files: 0
Duration: 1s
Some legitimate files are not included in this log
Previous Scan Results
CLEAN - [Wed 2016-03-02 19:13:42] 1 files scanned, 0 infections found in 1s
CLEAN - [Tue 2016-03-01 20:44:38] 13059 files scanned, 0 infections found in 2m 49s
CLEAN - [Tue 2016-03-01 15:53:01] 13458 files scanned, 0 infections found in 2m 24s
CLEAN - [Mon 2016-02-29 16:14:53] 11452 files scanned, 0 infections found in 3m 14s
CLEAN - [Sun 2016-02-28 16:54:01] 10664 files scanned, 0 infections found in 1m 34s
CLEAN - [Sat 2016-02-27 15:53:08] 10802 files scanned, 0 infections found in 1m 35s
CLEAN - [Fri 2016-02-26 16:54:11] 12754 files scanned, 0 infections found in 2m 13s
CLEAN - [Thu 2016-02-25 15:53:05] 13280 files scanned, 0 infections found in 1m 34s
CLEAN - [Wed 2016-02-24 16:02:44] 10374 files scanned, 0 infections found in 1m 42s
CLEAN - [Tue 2016-02-23 20:40:24] 1723 files scanned, 0 infections found in 3s
CLEAN - [Tue 2016-02-23 17:49:47] 9489 files scanned, 0 infections found in 1m 21s
CLEAN - [Sun 2016-02-21 20:43:55] 10418 files scanned, 0 infections found in 1m 11s
CLEAN - [Sun 2016-02-21 17:31:41] 7082 files scanned, 0 infections found in 1m 17s
CLEAN - [Sat 2016-02-20 16:28:55] 9460 files scanned, 0 infections found in 2m 24s
Current Session System Statistics
[04:54 PM] - CPU: 5%, Physical Memory: 16%, Virtual Memory: 6%, Page File: 13%, Processes: 27
[05:09 PM] - CPU: 32%, Physical Memory: 54%, Virtual Memory: 7%, Page File: 54%, Processes: -125
[05:24 PM] - CPU: 48%, Physical Memory: 33%, Virtual Memory: 7%, Page File: 29%, Processes: -126
[05:39 PM] - CPU: 13%, Physical Memory: 50%, Virtual Memory: 7%, Page File: 53%, Processes: -122
[05:54 PM] - CPU: 31%, Physical Memory: 56%, Virtual Memory: 7%, Page File: 61%, Processes: -120
[06:09 PM] - CPU: 6%, Physical Memory: 55%, Virtual Memory: 7%, Page File: 62%, Processes: -111
[06:24 PM] - CPU: 18%, Physical Memory: 53%, Virtual Memory: 7%, Page File: 62%, Processes: -123
[06:39 PM] - CPU: 13%, Physical Memory: 53%, Virtual Memory: 7%, Page File: 62%, Processes: -118
[06:54 PM] - CPU: 12%, Physical Memory: 51%, Virtual Memory: 8%, Page File: 59%, Processes: -121
[07:09 PM] - CPU: 9%, Physical Memory: 51%, Virtual Memory: 8%, Page File: 61%, Processes: -118
[07:24 PM] - CPU: 8%, Physical Memory: 53%, Virtual Memory: 8%, Page File: 63%, Processes: -115
Processes: 0, Modules: 0 (Depth: 36, Type: 16, Analyzed: 1, Threads: 0, Center: 0 - 0)
--- End of Scan Log ---
Hope you guys can help me:D,
SPMNJ

